

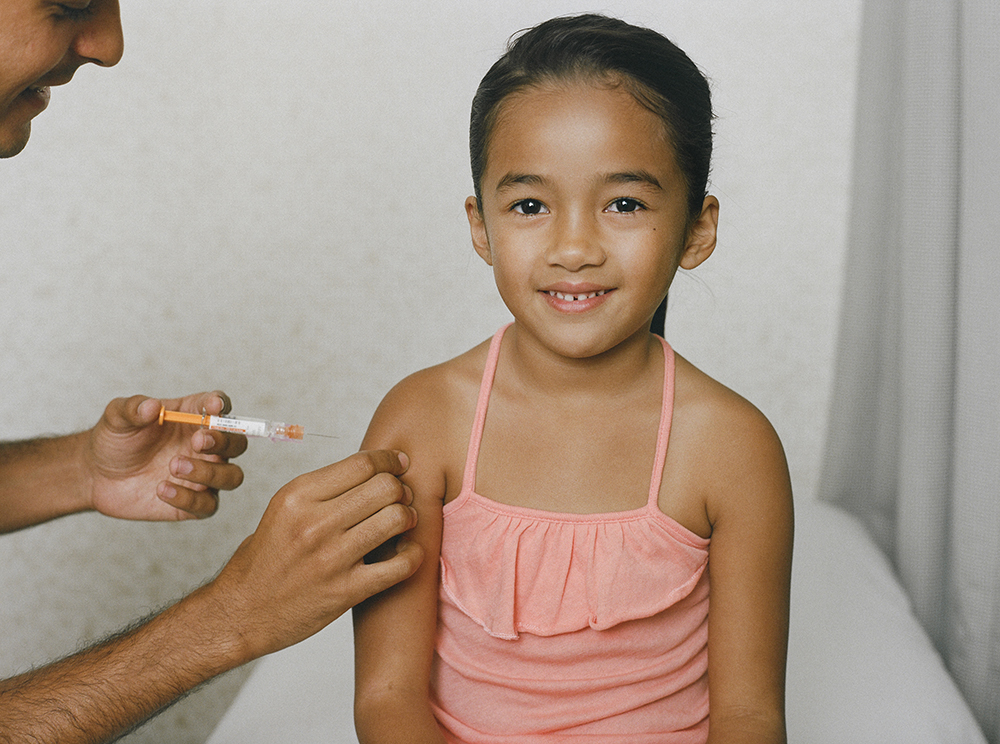
Kindergarten exemptions from at least one vaccination required for public school jumped 17% for the 2025-2026 school year over the previous year, according to the annual 2026 CDC report on Vaccination Coverage and Exemptions among Kindergartners published August 17. The report is released annually in late summer or early fall, and the data is incorporated into the SchoolVaxView interactive site, an invaluable resource for journalists reporting on national and state-level immunization rates in children.
SchoolVaxView overview
Although the CDC has experienced substantial disruptions and alterations in data since January 2025, this report is among the agency’s data sets that appear reliable. The annual report provides key information each year that nearly always warrants a story, but the interactive data set’s real value is the ability to compare the current year’s data with previous years, by state and/or by vaccine.
The data set dates back to the 2017-2018 school year, and site visitors can toggle which states and vaccines they want to see trends for. The population is kindergarteners entering the previous school year in the 50 U.S. states plus Washington, D.C., and the city of Houston, Texas. The vaccines covered are measles-mumps-rubella (MMR), diphtheria-tetanus-pertussis (DTaP), hepatitis B, polio, and varicella (chickenpox).
The site also allows visitors to look specifically at exemptions for school-mandated vaccines, which have been growing particularly since the pandemic, most recently from 3.6% to 4.2% in the current dataset. You can toggle graphs for medical and non-medical exemptions and look at exemptions for specific vaccines or even vaccine doses (such as the first dose, second dose or “up-to-date” status of varicella vaccination).
Other features of the data set include “potentially achievable coverage,” which can help visualize rates across states; a map of high, medium, and low coverage of vaccines by state; and a data table that allows people to look at specifics on where the data came from and the population it was drawn from.
The primary contact for the data is the CDC, whose access to public information officers varies. Other valuable sources for comment on the data include the American Academy of Pediatrics, the Infectious Diseases Society of America, the National Foundation for Infectious Diseases, the Pediatric Infectious Diseases Society, and the American Academy of Family Physicians.
How to use this data
Stories about this report typically focus on the most recent findings. In 2026, for example, vaccination rates declined among children entering kindergarten for all vaccines, but coverage still remains high at 92% for DTaP, 94% for hepatitis B, 92.4% for polio, 92.3% for varicella, and 92.4% for MMR.
The latter is not high enough for measles herd immunity, which requires over 95% of susceptible individuals to be immunized, according to a prepared statement from American Academy of Pediatrics President Andrew Racine, M.D., Ph.D.
Research on vaccine communication emphasizes the importance of social norms in vaccination confidence and intentions — perceiving that others are vaccinating increases likelihood of vaccination — so it’s important to take this research into consideration in your coverage of rates while still responsibly reflecting what the data show.
Beyond the new annual numbers, journalists can use this data to look at trends over time by vaccine, vaccine exemption, and by state. This data can be complemented by research studies on vaccination rates, vaccine hesitancy, and other related immunization topics, but no other source is more authoritative on kindergarten vaccination rates.
Some years, data is missing from certain states. Montana has not reported rates since the 2020-2021 school year, and Kansas has no data for 2025-2026. Journalists would need to contact those states’ health departments to learn why the data are unavailable and whether other estimates of coverage exist.
Story ideas for this dataset
Many of the story ideas using this dataset are self-evident, but there are opportunities for journalists to dig deeper:
- Why do some states have higher or lower rates than others?
- Why do some vaccines have higher or lower rates than others? Are there different attitudes or beliefs associated with certain vaccines, whether nationally or regionally?
- Are there any unexpected aberrations in the data, such as a sudden jump or drop for a particular vaccine, state, or year that deserves further investigation?
- How do state-level and national-level immunization rates obscure the actual risk of a disease outbreak when research has shown that geographic pockets of high exemptions or low vaccination rates can allow for an outbreak even in a state with otherwise high immunization rates?