
Federal, state and local officials use risk assessment tools called “social vulnerability indices” to identify places that may be hit harder by natural disasters and public health emergencies. These indices help officials decide where to send water, food, medical personnel and supplies during those situations and their aftermath. Some indices are being applied to track disease disparities and identify unmet social needs that make some Americans more vulnerable to illnesses.
Journalists can use these resources to bring equity-related context to stories about public health and how vaccination initiatives, pollution enforcement, food insecurity and economic tax break patterns, among other factors, can influence it.
Developed by researchers from a variety of disciplines, these measures score and rank states, counties and other population subdivisions. They include demographic indicators such as educational attainment, employment, English-language proficiency, insurance coverage and other social factors that influence health to determine how well communities can cope with and recover from emergencies like heat waves, disease outbreaks and more. They also rank areas using trend data on mortality and chronic health conditions including heart disease and diabetes.
Many social vulnerability indices offer both local and national data. Consider using them to write stories about what’s happening in your area and comparing it to the country at large.
You can also use the data to find out what public health officials and elected representatives are doing — or not doing — to improve the health of the people they serve and represent.
Below, you’ll find a list of risk evaluation instruments and projects I think should be on your radar.
Resources
- California Healthy Places Index: This tool ranks cities, zip codes and census tracts on educational attainment, drinking water contamination and insurance coverage. According to the website, the project was created by the Public Health Alliance of Southern California, a group of local health departments.
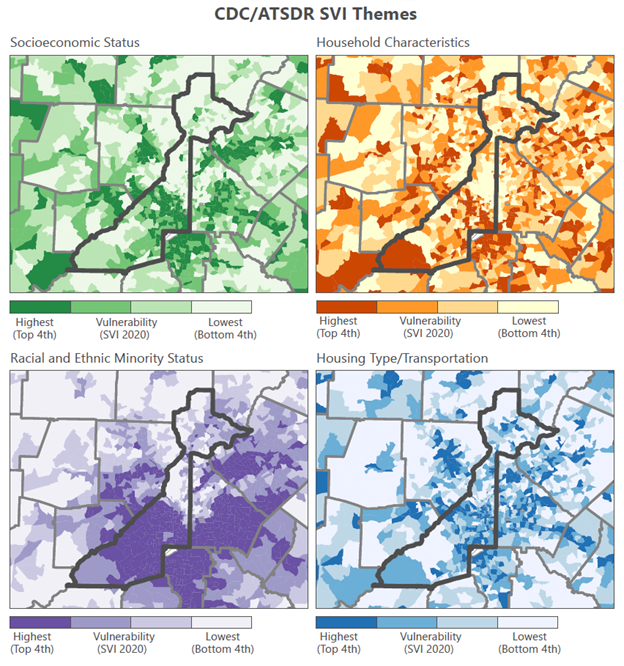
- CDC/ATSDR Social Vulnerability Index: Created more than a decade ago, this tool uses data from the U.S. Census Bureau. It scores and ranks states and counties on socioeconomic status, housing type and vehicle access, race and ethnicity, and household characteristics.
- CDC Environmental Justice Index: This index measures an area’s vulnerability to air pollution, exposure to potentially toxic sites and cancer risk associated with more than 100 dangerous air contaminants including benzene, dioxin and formaldehyde. It also tracks areas with high-risk facilities that are under the Environmental Protection Agency’s Risk Management Program.
- Minority Health Social Vulnerability Index: This index was developed by the CDC and the U.S. Department of Health and Human Services to help federal, state and county officials better allocate resources to curb the spread of COVID-19 among Black, Hispanic, and Native American and Alaska Native people, who have been at higher risk of dying from the disease. HHS is promoting the measure as a tool for policymakers, nonprofits and local governments to improve the well-being of people of color.
- Wisconsin Climate and Health Vulnerability Indices: According to their website, the project developers used census, health and built environment data to measure heat risk in the state, as well as in Milwaukee and surrounding areas. The health indicators include chronic conditions, mental health services and insurance coverage.