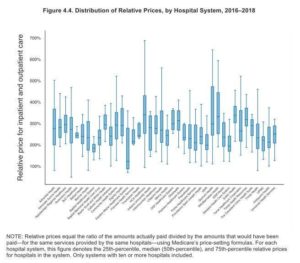
Research released today shows that from 2016 through 2018, self-insured employers and commercial health insurers in 49 states and the District of Columbia paid 247% more, on average, than what the Medicare program would have paid for the same inpatient and outpatient hospital services.
Researchers from RAND analyzed hospital claims data from 3,112 hospitals in every state except Maryland, which was excluded because the state has an all-payer rate setting model in which hospitals charge prices that are equal to what Medicare and private insurers pay, the report explained. The claims totaled $33.8 billion and came from self-insured employers, six state all-payer claims databases and health plans from 2016 to 2018.
Christopher M. Whaley, RAND’s lead author of the report, explained that if the employers and the commercial health plans participating in the study had used Medicare’s payment formulas, they could have saved $19.7 billion or 58 percent of what they paid from 2016 to 2018.
The report, “Nationwide Evaluation of Health Care Prices Paid by Private Health Plans,” builds on two earlier reports that RAND and the Employers’ Forum of Indiana, an employer-led health care coalition, have done since 2017. Those previous studies on hospital prices were, “Hospital Price Comparisons in Indiana,” in 2017, and “Prices Paid to Hospitals by Private Health Plans Are High Relative to Medicare and Vary Widely,” in 2019.
“We think what Medicare pays is a good benchmark,” Whaley said in a phone interview this week. “Maybe we don’t think that employers should be paying exactly the same amount, but finding that they’re paying nearly 2.5 times what Medicare paid was surprising.”
Another surprise in the report is the wide variability of prices across hospitals and within health-systems ranging from 168% to 387% of Medicare rates in 2018. Such variations are based on the structure of individual hospital markets, Whaley added.
The research shows that inpatient prices (which are a combination of facility fees and professional provider fees), ranged from 134% to 328% of Medicare in 2018 and outpatient prices (which are facility fees and professional fees), ranged from 186% to 442% of Medicare in 2018.

In addition to showing wide variation in hospital facility and professional prices, the report also will be useful for journalists in every state and every hospital market because it identifies the top 10 most expensive health systems in each state and reports individual hospital prices and quality and patient-safety measures. One of the strengths of all three RAND studies on hospital prices is that they name hospitals and hospital systems under joint ownership.
In the study, RAND said prices reflect the negotiated allowed amount paid per service, including those amounts from both the health plan and the patient. Adjustments were made for the intensity of services provided. “We report differences in standardized negotiated prices and prices relative to Medicare reimbursement rates for the same procedures and facilities,” RAND explained.
What employers and employee unions pay for health care represents the largest source of health insurance coverage in the United States. Despite the size and importance of that market, prices are opaque, RAND noted. The report aims to provide price transparency into that market where it has not previously been available. That level of transparency may allow employers and health plans to compare prices among hospitals and other providers.
The Robert Wood Johnson Foundation and self-insured employers funded the research. The 55-page report is available here (PDF) and a supplemental data file (XLSX) is available here. The data file includes state-level information and other details.
The report, the supplemental data in a spreadsheet and an interactive map are available on the RAND site at this link.
The American Hospital Association and the Healthcare Financial Management Association did not respond to a request for comment from AHCJ.


