

Progress toward widespread price transparency comes slowly, according to the latest annual report from the Health Care Incentives Improvement Institute (HCI3) and the Catalyst for Payment Reform (CPR). In the “Report Card on State Price Transparency Laws – July 2016,” issued on Tuesday, the authors, Suzanne Delbanco, CPR’s executive director, and François de Brantes, HCI3’s executive director, explained what states are doing to give consumers the information they need to shop for care based on price.
As in past years, most states are doing poorly: 43 states earned an F grade for failing to meet even minimum standards. Last year, 45 states got an F.
This year, three states earned an A: Colorado, Maine and New Hampshire. Last year, only New Hampshire got the highest grade.
After making sustained improvements over the past 12 months, Oregon moved from an F to a B, HCI3 and CPR reported. Vermont and Virginia each got a C, and Arizona got a D. All other states got a failing grade.
Looking ahead, there is some potentially positive news. About a dozen states already have collected the best data on price in all-payer claims databases. To move up in the rankings they need high-quality websites to display that data, the report showed.
“The quality of their transparency websites drove up Colorado’s and Maine’s grades (and contributed to Oregon’s new grade), underscoring that how states present price information – in addition to how they collect it – is essential for making price information accessible and usable for consumers,” the report said.
For journalists, one strength of the 18-page report is how it explains the steps that states are taking to make their price-transparency efforts more useful. It explains the great need for price transparency, the data sources states use, and provides information on each state’s efforts.
Included in the report is an article, “Best Practices to Maximize Consumer Use,” by Judith Hibbard, Dr.P.H., a research professor in the Health Policy Research Group at the University of Oregon. Hibbard is an expert on how consumers understand and use health care information.
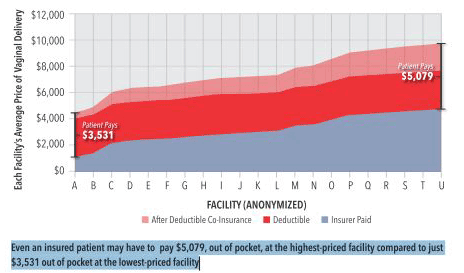
To demonstrate how price transparency could be more effective, the report included an analysis of average hospital prices for vaginal deliveries in one state. In a chart, those prices are shown from a low of $4,500 to high of almost $10,000. In that state, an insured consumer with a silver-level plan would pay $5,079 at the highest-priced hospital in out of pocket costs (meaning deductible plus co-insurance), but only $3,531 out of pocket at the lowest-priced facility, the report explained.