“Since when in America do we have classes? Since when in America are people stuck in areas or defined places called a class? That’s Marxism talk.”
– Rick Santorum, former U.S. senator
Unlike most other wealthy countries, the United States doesn’t keep good records on social class, so it’s taken longer here than in other wealthy countries to understand the profound impact of social class on people’s health.
“As a nation, we are uncomfortable with the concept of class. Americans like to believe that they live in a society with such potential for upward mobility that every citizen’s socioeconomic status is fluid,” Stephen L. Isaacs and Steven A. Schroeder observed a decade ago in an essay that has only become more relevant.
The latest data suggest that lack of social mobility remains as significant a problem as it was decades ago. In the generation entering the U.S. workforce today, those who started life in the bottom fifth of income distribution have about a 9 percent chance of reaching the top fifth. That compares with an 8.4 percent chance for kids born in 1971, according to research by economists Raj Chetty of Harvard, Emmanuel Saez of the University of California, Berkeley, and colleagues.
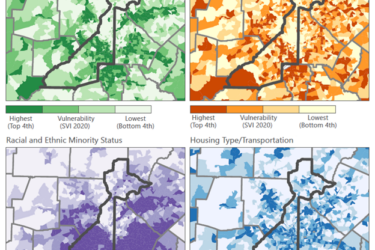
What’s astonishing are the huge differences in mobility depending on where you grow up, The odds of escaping poverty and gaining prosperity are less than 3 percent for kids in many places across the South and Rust Belt states. But in some parts of the Great Plains, more than 25 percent of kids born to the poorest parents move into the upper-income strata as adults, the economists found. The datasets are available here.

I don’t think it’s a coincidence that the places on this map with the lowest social mobility also tend to have the worst health outcomes. Lack of mobility is strongly correlated with worse segregation, greater income inequality, poor local school quality, diminished social capital, and broken family structure – factors that are also linked to poor health.
Even when poor children manage to escape poverty, a “birth lottery” may still determine who gets to live longest and healthiest. Exposure to adverse conditions during fetal development and early infancy appears to be capable of causing irreversible consequences decades later, such as increased vulnerability to weight gain, diabetes, heart disease, and premature death.
The U.S. made steady progress reducing socioeconomic and racial/ethnic health disparities during the 1960s and 70s. (This period, in fact, was the only time in modern U.S. history when the health of African Americans improved more rapidly than the health of whites, occurring with civil rights and anti-poverty programs that narrowed the black-white income gap.)
Progress stalled around 1980. Since then, health inequities have grown wider between members of the lowest and highest social classes. Life expectancy, for instance, has changed very little among the less-educated and virtually all gains in life expectancy occurred among highly educated groups, one study found. If everyone in the U.S. attained the longevity of the highest-income one-fifth of the white population, we would have seen 14 percent fewer premature deaths among whites, and 30 percent fewer deaths among non-whites between 1960 and 2002, another study calculated.
Ten years ago, Isaacs and Schroeder argued for what is now called “health in all policies.” That’s the idea that we should explicitly consider the health impact of the priorities we set in education, taxes, recreation, transportation, and housing. A handful of state and local governments have taken steps in this direction.
A development worth watching is the growing use of health impact assessment to scrutinize the effects that a government program or project may have on the health of a population. The systematic assessment is supposed to help policy makers avoid unintended harmful effects and take advantage of opportunities to promote health.
After a health impact assessment in Alaska, for example, the Bureau of Land Management in 2007 withdrew part of an oil and gas development lease that threatened the health of native populations, and the approved lease required new pollution monitoring and controls. In Boston last year, the regional transit agency held off imposing steep fare increases and service cuts after a health impact assessment concluded that it would lead to significant health and financial costs because of increased automobile use.
The number of health impact assessments has mushroomed from a few dozen in 2007 to more than 240 completed or in progress in 35 states, Washington, D.C., Puerto Rico, and at the federal level as of last year, according to a recent Institute of Medicine report.
But big hurdles do pop up. The Robert Wood Johnson Foundation recently analyzed 23 health impact assessments completed between 2005 and 2013. Most weren’t given enough time or money, the authors concluded. People doing the assessments struggled to find relevant, neighborhood-level data. And they found it tough to make headway in politically charged situations. In some cases, agencies moved ahead on project decisions without waiting for completion of the health impact assessment. The behind-the-scenes maneuvering strikes me as something journalists might want to dig into.


