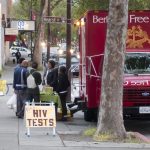
A person’s ZIP code could determine their risk of being fatally shot by police, according to a recent study published in the American Journal of Preventive Medicine.
After analyzing 6,901 fatal police shootings between 2015 and 2022 across 32,736 ZIP codes, researchers found that fatal police shootings rose significantly, by eight times, as the social vulnerability index rose. The most notable spikes were seen in Hispanic (27.1 times) and Black (20.4 times) populations. The ZIP codes with the most police shootings were also likely to be majority-minority communities with high rates of poverty.
“Our findings reveal stark and alarming disparities in fatal police shootings that cannot be attributed to a single factor,” said Hossein Zare, Ph.D., an associate research professor at the Johns Hopkins Bloomberg School of Public Health and lead author of the study. “Instead, they reflect the intersection of social vulnerability, race, and geography.”
Why this matters
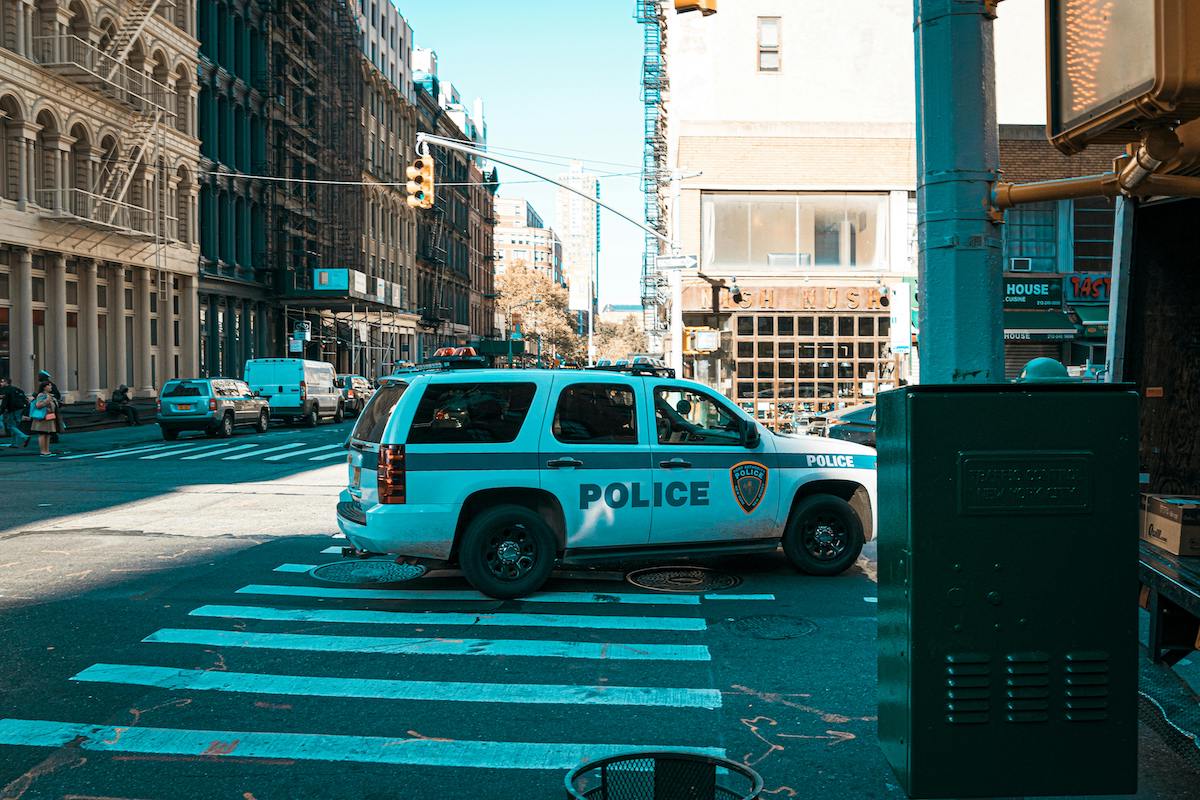
Each year, police shoot and kill more than 1,000 people throughout the U.S., according to the Washington Post. Yet law enforcement vastly undercounts fatal police shootings, which is why research and reporting provide a public accounting of police violence.
The database and subsequent reporting from the Washington Post on police shootings is an excellent example of how reporters can cover police violence in a way that holds law enforcement accountable.
This new study also demonstrates how public health issues like unemployment and poverty put people at a greater risk of being killed by police. Police violence isn’t often reported on as a public health issue, but this study is making the case that police shootings and public health can be intertwined.
Study methodology
Researchers used the social vulnerability index to categorize ZIP codes. The factors they included were socioeconomic status, household composition and disability, minority status and language, and housing type and transportation.
Researchers also factored in access to firearms, which the study says is a contributing reason for rising rates of fatal police violence.
“By analyzing these complex dynamics at the ZIP code level, we aim to highlight the urgent need to address the structural inequities that disproportionately place communities of color and socially vulnerable populations at higher risk,” Zare said in an October 2024 press release.
Their research provides a first-ever national analysis of deadly police shootings by ZIP code, according to the study. The study has limitations because the fatal police shooting data they used may not be complete.
Researchers examined thousands of fatal police shootings using figures from Mapping Police Violence and the Washington Post’s fatal force database.
Analyzing the findings
When race intersected with social vulnerabilities, the number of fatal shootings spiked. Researchers also found ZIP codes with the highest levels of violent crime had 1.79 times more fatal police shootings.
In 2022, for example, researchers determined that roughly 1,096 people were fatally shot by police, disproportionately impacting Black and Hispanic men and people living in areas with high rates of unemployment and social vulnerability.
“The study findings highlight the pressing need to address social vulnerability and racial disparities in police shooting rates, emphasizing the connection between accessibility of guns and racial structural injustices in police interactions, especially in communities of color,” researchers wrote in a news release about their study.
In their study, researchers said fatal police shootings can be reduced by policies that regulate carrying firearms in public and require licenses for firearm purchases. Other solutions they identified include community violence intervention programs and a thorough analysis of racial and socioeconomic differences to help understand and address disparities in fatal police shootings.
Resources
The two data sources researchers used for this study are also useful for reporters:
- Mapping Police Violence is a live police shooting tracker from Campaign Zero. They have tracked all police killings since 2013. The tracker documents fatal shootings by on-duty police officers and cases where police kill someone through the use of a chokehold, baton, taser or other means and killings by off-duty police.
- Washington Post’s fatal force database is another great resource that tracks fatal shootings by on-duty police officers going back to 2015. Their database is routinely updated and as of 2022, publishes the names of police agencies involved in each shooting.