Statistical significance is a test that researchers apply to their results to find out if their results represent real effects or if they could have occurred simply by chance. There are two main ways that statistical significance is reported in research: The P Value and the 95 percent confidence interval.
The P value is usually said to be “significant,” or unlikely to be the result of chance, if it is less than .05. Sometimes that threshold is .01, but it’s typically .05. A P value less than .05 means there’s a less than 5 percent probability that the result could have occurred by chance alone.
A different way of stating significance is the 95% confidence interval. Confidence intervals that do not cross the number 1 (the risk assigned to the reference group) are said to be statistically significant. In other words, both ends of the confidence interval are numbers below 1 or both are numbers above 1.
(Note: Study results can pass a test of statistical significance and still be wrong. By definition, the P value and 95% confidence interval chance of being right and a 5% chance of being wrong. It’s unlikely, but still possible.)
Deeper dive
Confidence intervals are a bit more descriptive than P values, and thus they can be more informative to reporters who are looking at a study. Rather than boiling the test of significance down to a yes/no answer as the P value does, the confidence interval shows the range over which the results may be true.
For example, consider this table from a recent study, published in the Archives of Internal Medicine, which reported a person’s chance of developing end-stage kidney disease if they were overweight or obese as a teen:
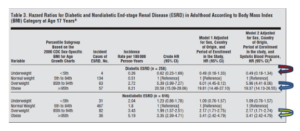
Reading the table tells us that people who were underweight at age 17 seem to have a slightly reduced chance of developing kidney disease as adults. Looking at the row highlighted by the red arrow, we see their hazard ratio is .49, after researchers adjusted their data to account for other things that might be influencing the risk of kidney disease. A hazard ratio of .49, means that their risk of developing kidney disease is reduced by about 51 percent (100-49=51) compared to the reference group, which was made up of people who were at normal weights as teenagers. Now check out the confidence interval which is reported in parentheses beside the hazard ratio.
The confidence interval shows that underweight individuals had chances of developing end-stage kidney disease that ranged from .18 to 1.34. That means the real risk of kidney disease for underweight people was anywhere from 82% less than the reference group (100-18=82) to 34 percent higher than the reference group. That’s pretty well all over the map. Because that confidence interval includes the number 1, we can say it’s unlikely that people who are underweight really have a 51 percent reduced chance of getting kidney disease compared to people who are normal weight. Their true risk is not known.
Now look at the row highlighted with the red arrow. These results are the chances that a person who was obese as a teenager would develop end-stage kidney disease as an adult. Their hazard ratio is 19.37 with a confidence interval that ranges from 14.13 to 26.55. That confidence interval shows us that the risk of end-stage kidney disease in this group is somewhere between 14 times and 26 times higher than it is for someone who is normal weight. Because that range doesn’t include the number 1, it’s unlikely that researchers observed these results due to chance alone.
Confidence intervals that are very wide, meaning that they encompass a very broad range of results, are less reliable than confidence intervals that are narrow. Narrow confidence intervals show that the intervention or variable had about the same effect on all the people in the group.
Now look at the lower half of the chart. The researchers knew that people who were overweight or obese were more likely than people at normal weight to develop diabetes later in life. Diabetes is a major contributor to kidney disease. They wanted to see if the relationship between weight and kidney disease was still there if they excluded people who had developed diabetes. Remarkably, when they looked at the data this way, the confidence intervals for the risks of being overweight or obese narrow even more, suggesting that those effects are even more reliable and likely to be real (yellow arrow).