As legislation targeting transgender people accelerates nationwide, journalists are being asked to cover an increasingly complex and politically-charged landscape. Yet newsrooms often lack the data needed to understand what narratives dominate national reporting — and what stories are being overlooked. The newly launched Trans News Initiative, a data tool created by the Trans Journalists Association (TJA) and partners at the University of Miami, aims to change that. Designed to track patterns in coverage across more than 200 U.S. news outlets, the tool gives reporters a clearer view of the frames, gaps and trends shaping public understanding of trans communities.
To understand how the tool came together and how journalists can utilize it to enhance coverage I spoke with Kae Petrin, TJA’s co-founder and project editor of the Trans News Initiative. Petrin, a data journalist at Civic News Company, discussed the motivations behind the initiative, the methodology and the opportunities health reporters can seize.
This conversation was edited for brevity and clarity.
What inspired the creation of the Trans News Initiative?
It came together as a collaboration between Alberto Cairo at the University of Miami, who has a lot of freedom to pursue data projects and really wanted to do something related to trans coverage. He has written publicly about having a trans kid and spoken about some of the bias he was seeing in news coverage. He approached us asking, ‘What could we do? What would be data-driven and helpful?’
We were having these conversations where we’d say, we’re seeing certain trends in coverage — and then when we brought those concerns to journalists or newsrooms, people would respond, ‘That’s interesting. Is there any research on that? Any data showing that trend?’ And we were all like, no — we just read a lot of news.
Part of the goal was to check our work. Do the trends we’re noticing anecdotally as journalists actually show up when you zoom out and analyze a larger universe of data over time? And how can we communicate those patterns in a way that helps journalists understand the stories they’re telling — and think critically about the narratives that emerge?
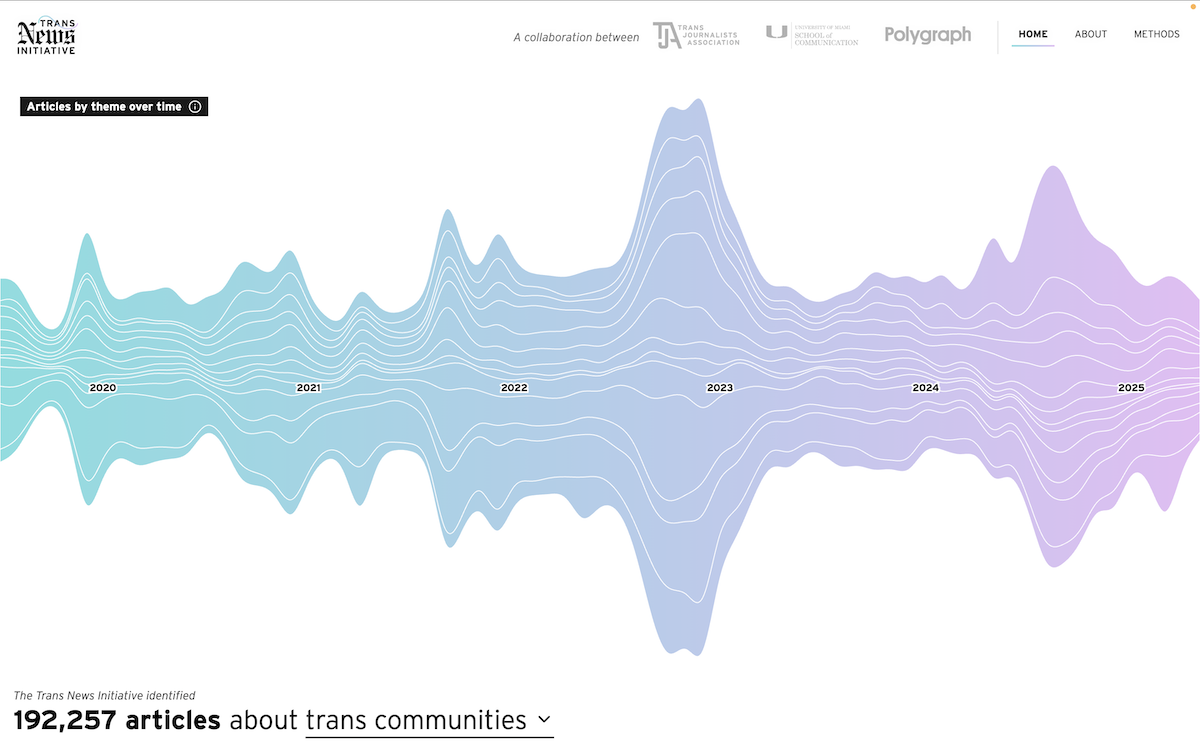
How far back does the dataset go, and how is it updated?
The tool is limited to 2020 through 2025, and for now will be manually updated monthly.
How did you gather the data?
We are working with an API called Media Cloud. We tested many options, and we ultimately chose Media Cloud because it was the most transparent about what it had and how it worked. Media Cloud is open source, so it’s also ethically aligned with our values as journalists.
Any tool that pulls large volumes of news stories has limitations. The legality of scraping news stories is gray in some contexts, and some newsrooms really do not want their content scraped.
Media Cloud met our concerns around transparency and openness — how they collect and store the data and what practices they use.
Health care and bodily autonomy coverage make up more than 18,000 articles. What do these trends show — and what can health journalists learn?
Health care is one of the biggest points of public debate and journalistic debate. Some of the most publicly criticized stories have been health stories that spread misinformation about trans communities or covered new health care restrictions. “We were careful to frame this not just as health care, but as coverage of bodily autonomy. At the core of the public debate around trans health care is the question of who gets to decide what health care a person receives in the United States.
You see a lot of coverage of transgender care restrictions, state-level youth care debates, stories about specific medical technologies like puberty blockers and conversations about conversion therapy.
One thing I don’t see is substantial coverage of HIV and AIDS policy. Looking at the data, I don’t see enough stories on this topic to create a topical subgrouping. That’s a real opportunity. When you scroll through the tool, you realize a lot of the stories repeat the same core ideas. What’s missing is coverage of everyday health care experiences, health discrimination, and other policies with major implications for trans communities. The coverage gaps can help journalists answer, ‘what other stories can we tell?’
What sources are included in the database of stories?
It’s a specific collection in Media Cloud of what they call national, but we would probably consider it local as well, because it includes many newspapers with national circulation. It’s more than 200 different sources. [Read more about the methodology here.]
How does the political-lean indicator work, and what should journalists take from it?
We really didn’t want to label a publication as left-leaning or right-leaning ourselves, so we combined several external rating sources and created a group rating based on multiple factors. It is not applied at the story level. It is applied at the publication level.
The goal is to understand that some topics are covered only by right-leaning publications, some only by left-leaning publications, and some that everyone covered for a few months — but then only conservative outlets kept covering in later years.
It’s about understanding which types of publications are interested in a story, and what audiences might not be hearing about an issue because only outlets on the other side of the political spectrum are covering it.
What does the future of the initiative look like?
We launched it on November 18, 2025. We’re now working to automate the system and make some of the pipeline processes more efficient. We also hope to expand the types of publications included. I think it would be really cool to add a collection of LGBTQ publications.
We want people to explore the tool. We want it to spark thought and conversation. We don’t have a lot of prescriptive analysis. What we want is for people to explore and think: I’m seeing all this care-ban coverage — how do I find broader stories related to this topic or perspectives we’re not hearing?
Those bills have continued to grow year after year. But when you look at the coverage, you don’t see continued reporting on what’s happening in specific states. We’re seeing less coverage of how states are implementing these laws and what the consequences are now that they’ve existed for a year or two.
That’s exactly where we hope the data can be illustrative — to show where the opportunities are for deeper storytelling.